All the code for this article can be found here.
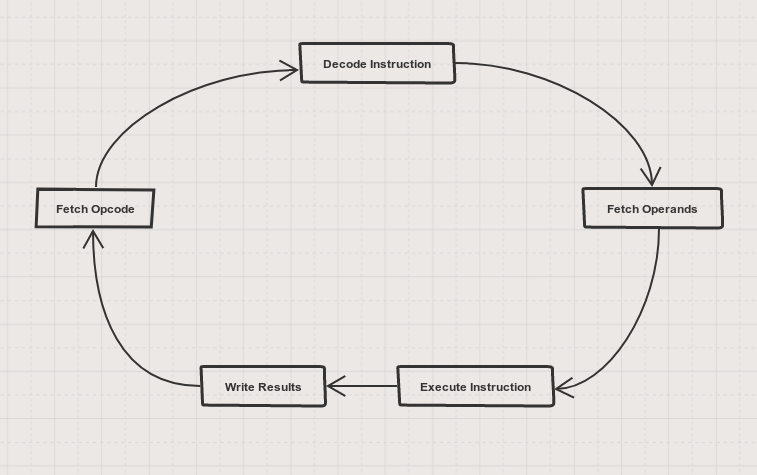
I’ve always been fascinated by video game console emulators. How could they even make a random computer act like something it’s not as if it was a teenager trying to fit in with the “cool” crowd. Working on my first emulator back when I was an undergraduate student, I answered some of my interrogations on the subject. Lo and behold, an emulator (for simple systems), at its most basic, is nothing more than an interpreter working on a particular machine code. That is to say, creating an emulator (again, for simple systems) comes down to implementing a dumb fetch-decode-execute cycle for a particular instruction set.
Being a performance junkie, I then began to muse about how this simple cycle could be implemented in the most optimal way. What follows is the tale of what can be engineered when you decide to sacrifice sanity at the altar of speed.
Benchmarking
In the cold hard world of computer science, you can’t prove the benefits of some data structure or algorithm unless you show some benchmarks. Otherwise, our work would be based on faith and hype and, most likely, false advertising. This is how sales people work, not us computer scientists. Consequently, we need an experimental setup i.e. a machine to emulate.
The machine
For the sake of simplicity, I propose a simple calculator machine. It’ll have an internal accumulator that’ll evidently be initialized to 0 and will change according to the instructions that it’ll execute. Each of these instructions will be two bytes long. The first byte will be the opcode i.e. the operation to perform. These operations will either be a binary arithmetic operation or a special operation signifying that the computation has come to an end. The second byte will be the operand i.e. the second term to use in a binary operation (the first term being obviously the accumulator). In addition, the machine will also possess a program counter (PC) to indicate which instruction it should be executing. Putting all of these requirements into code produce something like this:
1
2
3
4
5
6
7
8
9
10
11
12
class Calculator
{
public:
  enum Opcode { ADD, DIV, /* ... */, END };

public:
  long Execute(const std::vector<unsigned char>& program);

private:
  long m_accumulator{};
  int  m_pc{};
};
However, while fine and dandy, I won’t use this representation in what follows. Instead, the machine will be encoded implicitly in the functions that’ll serve as interpreters.
The program
Verily, I have but two requirements for a test program.
- Respect the instruction two bytes format outlined above.
- Contain a
deleted expletiveload of instructions so we can have meaningful benchmarks.
1
2
3
4
5
6
7
8
9
10
11
12
13
14
15
16
17
18
19
std::vector<unsigned char> GenerateProgram(int nbInst)
{
  std::vector<unsigned char> program;

  std::random_device device;
  std::mt19937 engine(device());
  std::uniform_int_distribution<> opcodeDistribution(0,7);
  std::uniform_int_distribution<> operandDistribution(1,100);

  for(unsigned long iOp = 0; iOp < nbInst; ++iOp)
  {
    program.push_back(opcodeDistribution(engine));
    program.push_back(operandDistribution(engine));
  }

  program.push_back(8);   // END

  return program;
}
For all results shown below, nbInst was 10,000,000.
The testing method
One or two measurement does not a serious benchmark make. To get serious, you need to have tools that’ll allow you to take as many sample as you want. I offer the below lambda as such a tool.
1
2
3
4
5
6
7
8
9
10
11
12
13
14
15
16
17
18
auto TimedExec = [&program](auto&& callable, int nbRepetition)
{
  using namespace std::chrono;

  nanoseconds total{};

  for(int iRep = 0; iRep < nbRepetition; ++iRep)
  {
    const auto start = system_clock::now();
    callable(program);
    const auto elapsed = system_clock::now() - start;
    total += elapsed;
  }

  const auto meanTime = duration_cast<milliseconds>(total / nbRepetition).count();

  std::cout << "Mean elapsed time: " << meanTime << std::endl;
};
For all results shown below, nbRepetition was 100.
perf
At this point, we have the test data and the testing method but no means to interpret (pun intended) the results. You could (and should) accept all my explanations like a wave of knowledge washing over you but I doubt that’ll satisfy everyone. Therefore, for the incredulous Thomases, I’ll use the Linux program perf to offer a glimpse into what’s happening with the CPU as the interpreter execute a program.
Interpreters
Indirect Switch Interpreter
A program of a thousand instructions begins with a single opcode
– Laozi (ish)
The first naive approach that I’ve explored was the indirect switch interpreter. In this algorithm, the logic of the emulated opcodes is encapsulated into an hash map of functions. A switch statement then drives the execution of the interpreter by calling the right function based on the opcode pointed by the PC.
1
2
3
4
5
6
7
8
9
10
11
12
13
14
15
16
17
18
19
20
21
22
23
24
25
26
27
28
29
30
31
32
33
34
35
36
37
38
39
40
41
42
using Program = std::vector<unsigned char>;
using OpcodeFtor = std::function<void(const Program&, int&, long&)>;
using OpcodeTable = std::unordered_map<Opcode, OpcodeFtor>;

long IndirectSwitchInterpret(const Program& program)
{
  static OpcodeTable table = {
      { ADD, [](const Program& program, int& pc, long& value)
             { value += program[++pc]; ++pc; } },
      { DIV, [](const Program& program, int& pc, long& value)
             { value /= program[++pc]; ++pc; } },
      // Add any other you'd like here
    };

  long value{};
  int pc{};
  const size_t programSize = program.size();

  while(pc < programSize)
  {
    switch(program[pc])
    {
      case 0:
        table[program[pc]](program, pc, value);
        break;
      case 1:
        table[program[pc]](program, pc, value);
        break;
      /////////////////////////////////
      /* Add some more to your taste */
      /////////////////////////////////
      case 8:
        return value;
      default:
        assert(false && "Unknown opcode");
        return 0;
    }
  }

  assert(false && "Program has no END");
  return value;
}
Running this interpreter, we find out that it takes on average 135 ms to execute a program. In other words, as an English-Canadian friend of mine would say, it’s as slow as molasses going uphill on a cold January morning.
1
2
Average program execution time:
indirectswitch: 135 ms
Just to get a clearer picture of our starting point, here’s an excerpt of the output of perf stat for this interpreter in table form:
| cycles | instructions | branches | branch misses | |
|---|---|---|---|---|
| Indirect Switch | 49,411,804,258 | 31,449,115,840 | 8,173,865,583 | 894,486,176 |
Loop Interpreter
Every subroutine should be made as simple as possible, but not simpler.
– Albert Einstein (ish)
It’s plain to see that the previous code snippet exhibit a criminal disregard of the DRY (Don’t Repeat Yourself) principle. The most obvious way to improve it (at least in terms of readability) was to substitute the switch for a direct call to the function implemeting the current opcode.
Do note though that this approach only works because of the way I’ve designed the calculator machine. Real machine instruction opcodes are rarely this linear and makes the previous interpreter a better first approach.
1
2
3
4
5
6
7
8
9
10
11
12
13
14
15
16
17
18
19
20
21
22
23
24
25
26
27
28
29
30
31
32
long LoopInterpret(const Program& program)
{
  static OpcodeTable table = {
      [](const Program& program, int& pc, long& value)
      { value += program[++pc]; ++pc; },
      [](const Program& program, int& pc, long& value)
      { value /= program[++pc]; ++pc; }
      // Extend it as you wish
  };

  long value{};
  int pc{};
  const size_t programSize = program.size();

  while(pc < programSize)
  {
    if(program[pc] > 8)
    {
      assert(false && "Unknown opcode");
      return;
    }
    else if(program[pc] == 8)
    {
      return value;
    }

    table[program[pc]](program, pc, value);
  }

  assert(false && "Program has no END");
  return value;
}
If we go to the judges’ scorecards, we see that it now takes on average 125 ms ot execute a program. The gains are there but they aren’t that spectacular (yet).
1
2
3
Average program execution time:
indirectswitch: 135 ms
loop: 125 ms
What does perf says?
| cycles | instructions | branches | branch misses | |
|---|---|---|---|---|
| Indirect Switch | 49,411,804,258 | 31,449,115,840 | 8,173,865,583 | 894,486,176 |
| Loop | 47,714,383,334 | 33,451,525,769 | 6,299,707,023 | 885,182,452 |
Interesting. This interpreter executes more instructions than the Indirect Switch Interpreter yet it runs faster. How come? Wouldn’t more instructions put more pressure on the instructions cache (icache) and therefore results in slower code?
The answer is: it depends. If we execute the same instructions over and over again, the icache will contribute to glorious results. If not, it will thrashed as often a freshman during initiation week.
Furthermore, in this situation, you have to consider that this interpreter went through far fewer branches than the previous interpreter. While it’s true that modern CPU have powerful branch predictors to keep the instructions flowing in the pipeline as much as possible, the sad truth is that they’re not omniscient. They can mispredict and when they do, a pipeline flush is necessary. Evidently, this flushes both instructions and performance down the drain.
Direct Switch Interpreter
We can solve any problem by introducing an extra level of indirection, except for the problem of too many levels of indirection.
– Andrew Koening (ish)
By this point, I began to see the cracks in the teaching of my forebears. Adding a layer of indirection might not be such a good advice in all cases. In fact, I began to question if our love for indirection might not be the result of Orwellian conditioning passed down from previous generations of programmers.
Defying my predecessors, I went for it; I put the opcode handling logic directly inside the case where it belonged. For a machine so small, it could be done so easily after all.
1
2
3
4
5
6
7
8
9
10
11
12
13
14
15
16
17
18
19
20
21
22
23
24
25
26
27
28
29
30
31
32
33
34
35
36
long DirectSwitchInterpret(const Program& program)
{
  long value{};
  int pc{};
  const size_t programSize = program.size();

  while(pc < programSize)
  {
    switch(program[pc])
    {
      case 0:
        value += program[++pc];
        ++pc;
        break;
      case 1:
        value /= program[++pc];
        ++pc;
        break;
      case 2:
        value *= program[++pc];
        ++pc;
        break;
      //////////////////////////
      /* Use your imagination */
      //////////////////////////
      case 8:
        return value;
      default:
        assert(false && "Unknown opcode");
        return 0;
    }
  }

  assert(false && "Program has no END");
  return value;
}
From an 124 ms mean program execution time, we’re now down to an 94 ms. The numbers did not lie, I was on the track to success.
1
2
3
4
Average program execution time:
indirectswitch: 135 ms
loop: 125 ms
directswitch: 94 ms
In fact, perf was painting quite a clear picture now:
| cycles | instructions | branches | branch misses | |
|---|---|---|---|---|
| Indirect Switch | 49,411,804,258 | 31,449,115,840 | 8,173,865,583 | 894,486,176 |
| Loop | 47,714,383,334 | 33,451,525,769 | 6,299,707,023 | 885,182,452 |
| Direct Switch | 35,298,486,061 | 13,072,102,988 | 4,173,586,593 | 885,258,057 |
Simpler programs produce more optimized binary code that need to execute less instructions to produce the same result. Case in point: the Direct Switch Interpreter executed instructions count is a little over a third of the Indirect Switch Interpreter.
For a second time I had whispers that branches had to go; we should get rid of them like Starks at the Red Wedding.
Indirect Threaded Interpreter
Behold I teach you the computed goto: it is that lightning, it is that madness!
– Friedrich Nietzsche (ish)
I knew what had to be done. I had to remove branches as if I was deforesting the Amazon rainforest. Since common wisdom could not help me anymore, I had to turn to the arcane.
In the land of C/C++ language extensions, there exist something called a computed goto. As far as I can tell, it spawned from the womb of GCC. What it all boils down to two is an unholy union of two ghastly features. First, it allows for storing label addresses inside (void*) variables. Second, it grants the possibility of invoking a goto on a variable expression. What all of this enabled me to do was to create a new jump table which negated the need for a loop inside the interpreter.
1
2
3
4
5
6
7
8
9
10
11
12
13
14
15
16
17
18
19
20
long IndirectThreadedInterpret(const Program& program)
{
  static void* funcs[] = { &&ADD, &&DIV, &&MUL, &&SUB,
                           &&MOD, &&AND, &&OR, &&XOR, &&END };
  long value{};
  int pc{};
  goto *funcs[program[pc]];

ADD:
   value += static_cast<int>(program[++pc]);
   goto *funcs[program[++pc]];
DIV:
   value /= static_cast<int>(program[++pc]);
   goto *funcs[program[++pc]];
///////////////////////////////////////
/* Use the power of your imagination */
///////////////////////////////////////
END:
  return value;
}
Executing this new interpreter, we again were able to further gain some precious milliseconds in our benchmark.
1
2
3
4
5
Average program execution time:
indirectswitch: 135 ms
loop: 125 ms
directswitch: 94 ms
indirectthreaded: 91 ms
Not great but not terrible either.
What happened? perf, tell me that I’m going in the right direction!
| cycles | instructions | branches | branch misses | |
|---|---|---|---|---|
| Indirect Switch | 49,411,804,258 | 31,449,115,840 | 8,173,865,583 | 894,486,176 |
| Loop | 47,714,383,334 | 33,451,525,769 | 6,299,707,023 | 885,182,452 |
| Direct Switch | 35,298,486,061 | 13,072,102,988 | 4,173,586,593 | 885,258,057 |
| Indirect Threaded | 36,260,932,871 | 13,072,319,964 | 1,298,940,541 | 885,142,693 |
Damn it all! Despite getting rid of about three quarters of the remaining branches I had not made the progress I was hoping for.
Direct Threaded Interpreter
The C++ language is indeed comic, but the joke is on programmers.
– H.P. Lovecraft (ish)
At this point, I realized that to quench my need for speed, executing the program as it was given to me was a fool’s errand. I still had one too many indirection: indexing into the funcs arrays. What I need to do was decipher the program into a form where all it had to do was perform an arithmetic operation and strictly follow a pointer to the next operation.
1
2
3
4
5
6
7
8
9
10
11
12
13
14
15
16
17
18
19
20
21
22
23
24
25
26
27
28
29
30
31
32
long DirectThreadedInterpret(const Program& program)
{
  static void *funcs[] = { &&ADD, &&DIV, &&MUL, &&SUB,
                           &&MOD, &&AND, &&OR, &&XOR, &&END };

  std::vector<const unsigned char*> bytecode;
  bytecode.reserve(program.size());
  for(int i = 0; i < program.size(); i += 2)
  {
    bytecode.push_back(static_cast<const unsigned char*>(funcs[program[i]]));
    bytecode.push_back(&program[i + 1]);
  }

  long value{};
  const unsigned char** pc = bytecode.data();
  const void* nextFunc = *pc;
  goto *nextFunc;

ADD:
  value += static_cast<int>(**++pc);
  nextFunc = *++pc;
  goto *nextFunc;
DIV:
  value /= static_cast<int>(**++pc);
  nextFunc = *++pc;
  goto *nextFunc;
  /////////////////////////////////////////////////////
  /* Add as many arithmetic operations as you'd like */
  /////////////////////////////////////////////////////
END:
  return value;
}
Finally! The promised land! The promised speed! This interpreter flys on an average of 50 ms per program execution i.e. less than half of the original interpreter.
1
2
3
4
5
6
Average program execution time:
indirectswitch: 135 ms
loop: 125 ms
directswitch: 94 ms
indirectthreaded: 91 ms
directthreaded: 50 ms
This is unsurprising when looking at the interpreter from perf’s perspective:
| cycles | instructions | branches | branch misses | |
|---|---|---|---|---|
| Indirect Switch | 49,411,804,258 | 31,449,115,840 | 8,173,865,583 | 894,486,176 |
| Loop | 47,714,383,334 | 33,451,525,769 | 6,299,707,023 | 885,182,452 |
| Direct Switch | 35,298,486,061 | 13,072,102,988 | 4,173,586,593 | 885,258,057 |
| Indirect Threaded | 36,260,932,871 | 13,072,319,964 | 1,298,940,541 | 885,142,693 |
| Direct Threaded | 20,817,034,936 | 5,797,820,373 | 1,405,419,279 | 883,918,185 |
Yes, there are more branches in this program. However, I suspect that most of these “branches” might only be direct jumps. What’s more, the number of executed instructions has fallen off a cliff. This is most likely due to the eradication of indirect accesses in this interpreter. With that there are way less address computations and we now go to (pun intended) the next instruction quicker.
The End
There is still much to discuss concerning the inner workings of interpreters (or emulators for that matter). Truth be told, to create an emulator of more advanced machines we’ll most likely have to seek out new algorithms and data structures.
But that, my friend, is a story for another post.
Blogging teaches the attitude of the knife — chopping off what’s incomplete and saying: “Now it’s complete because it’s ended here.”
– Frank Herbert (ish)